Closedloop.ai
Data Loads & Recurring Data Load Configurations
In order to generate patient predictions, ClosedLoop's AI needs pre-existing data.
ClosedLoop's process for uploading data onto the platform relied entirely on the internal data science team to manually upload through their own code.
Role: Product Designer
Timeline: December 2022 - March 2023
Org Collaborators: Product Management, FE and BE Engineering, and Data Science
How can we create an experience that allows users - including those with limited data science coding knowledge - to upload and configure their data within the platform's interface?
BACKGROUND
Existing UX & UI
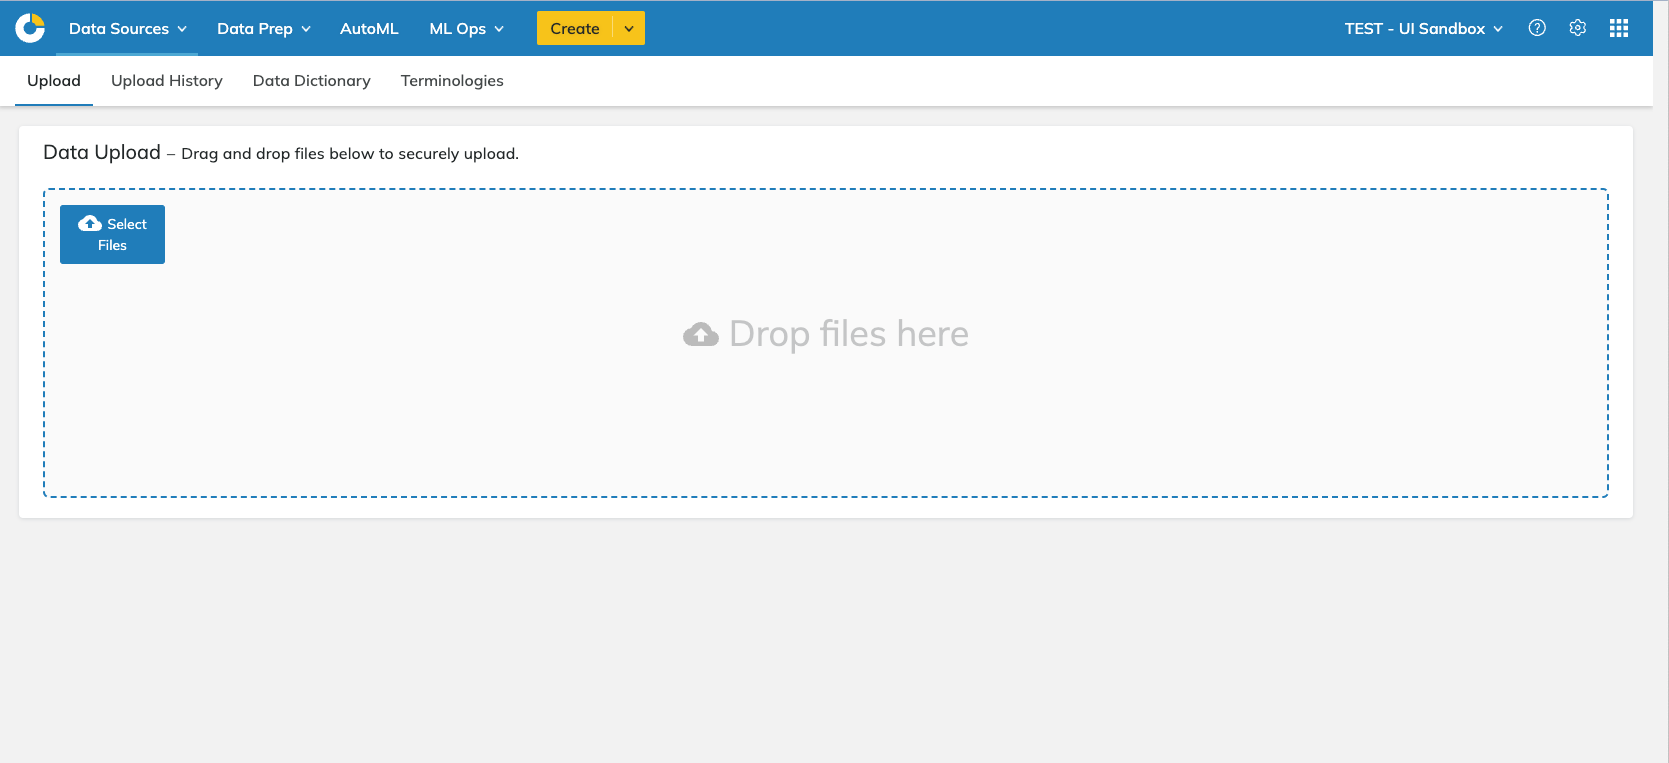
The current UX/UI for data loads was limited. The platform had a file upload screen, but it lacked the necessary information and required the internal data science team to handle all uploads on the back end.
Screens
User Objectives
- Autonomously upload data to the ClosedLoop platform through the user interface.
- Have the option to create a one-time load or a recurring load as necessary.
- Make adjustments to the dataset columns as needed without requiring the backend.
Metrics for Success:
- Reduction in the average time per data load.
- Improvement in the usability rating of the data configuration interface based on user feedback.
- Decrease in the number of data loads support requests.
Business Objectives
- Enhance platform adoption and usability for a wider range of users, including those with limited data science knowledge.
- Reduce the workload and dependency on the internal data science team for managing uploads.
- Differentiate the platform by offering a seamless and user-centric data uploading process compared to larger competitors.
Metrics for Success:
- Growth in the number of active users engaging in loading data.
- Reduction in errors or issues encountered during data uploading and configuration.
- Reduction in the hours spent by data scientists troubleshooting and manually inputting.
User Research & Challenges
Through preliminary user research, I found the following user challenges:
"I dread doing data loads - not only is the process entirely manual and on [the internal data scientists], but it can take many hours to figure out what went wrong if there's an error."
"There is no way for us to get an idea of what the table looks like before we load it. I'm going in blind and hoping for the best."
"The part that consistently takes me the longest to accomplish is the manual adjustments of the tables. I work on them in the API, then wait until it's loaded to know whether it's correct, which it's often not."
MAPPING & LOW-FIDELITY ITERATIONS
User Flow
This flow integrates Table Sources, Data Load Configurations, and Data Loads History to enable users to:
- locate tables and build individual loads using table source objects,
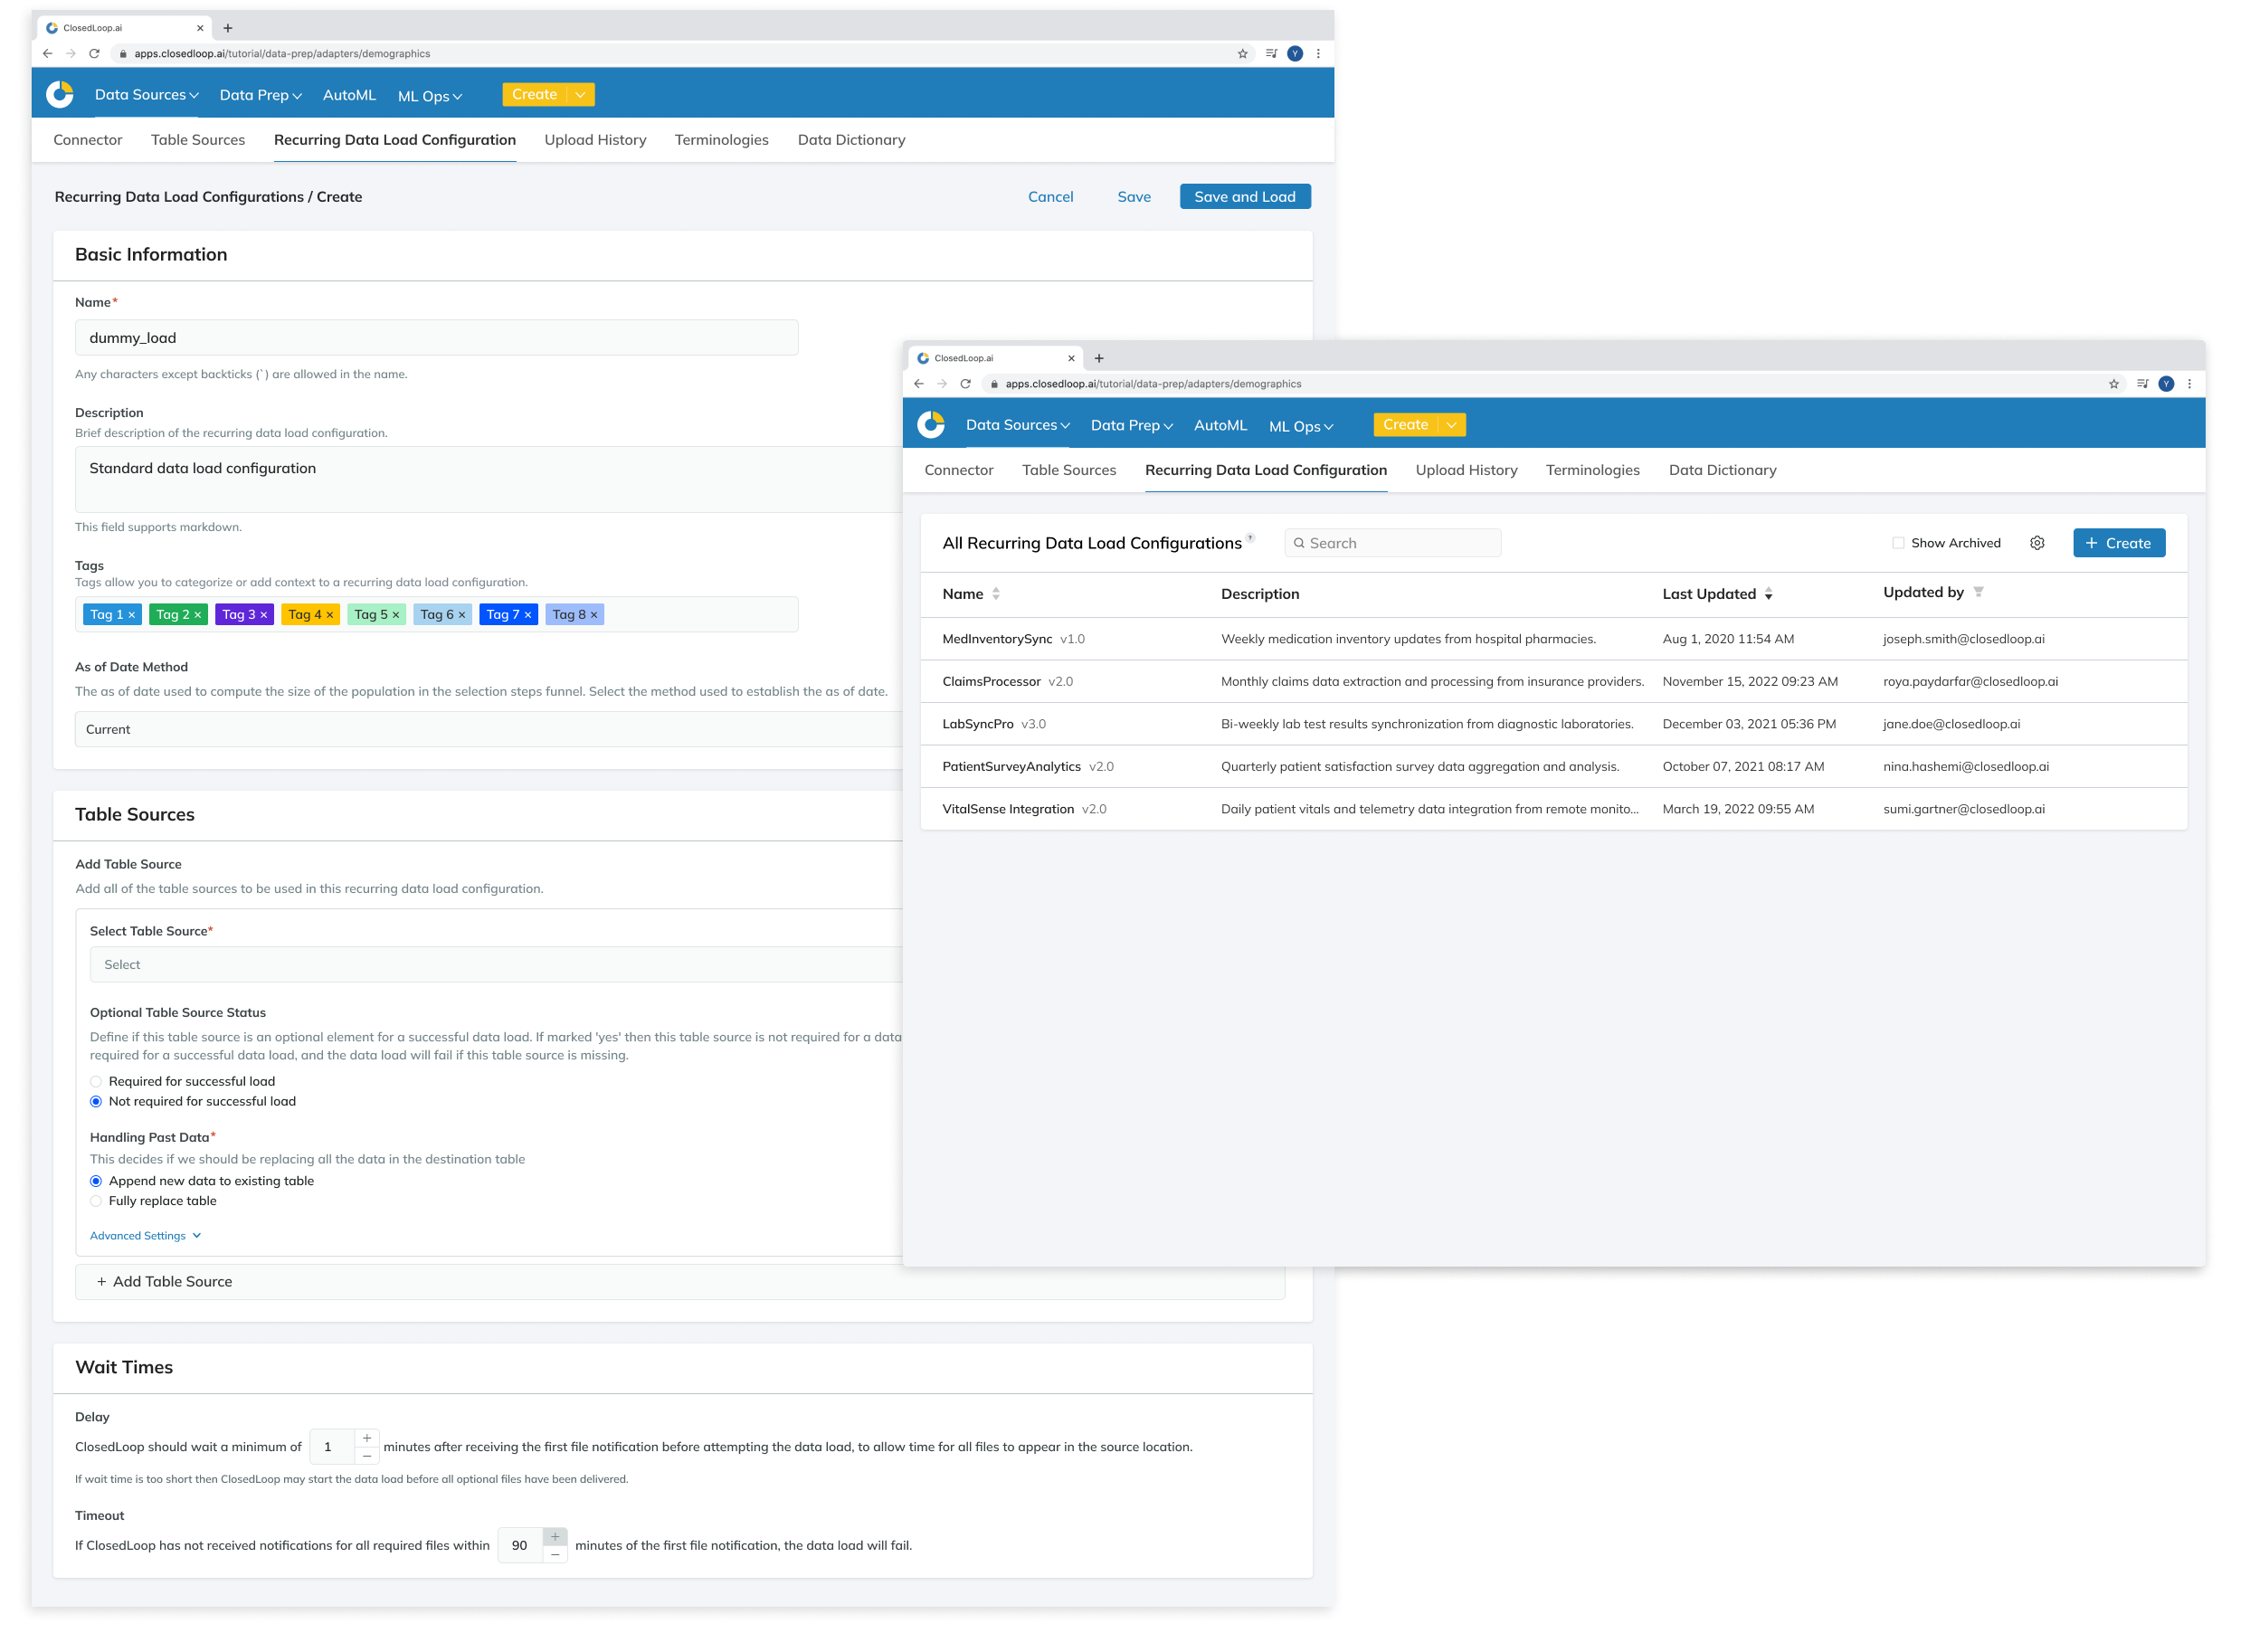
- automate to be recurring and/or combine table sources into one load using data load configuration objects,
- track and manage all loads through the data loads history page.

Wireframes & Stakeholder Approval
User flows and wireframe iterations were shared with stakeholders and internal data science users for feedback and approval.

V1 HIGH FIDELITY DESIGNS & INTERNAL USER TESTING
High-Fidelity Designs v1
Considering user and business goals, as well as technical limitations, we developed the initial high-fidelity designs, and prototyped them for user testing.


Internal User Testing
For the first round, testing was done with four internal data science users.
Research Goals:
- Understand if users are able to navigate the current flows
- Check for an understanding of how users can input and navigate load paths and future load paths
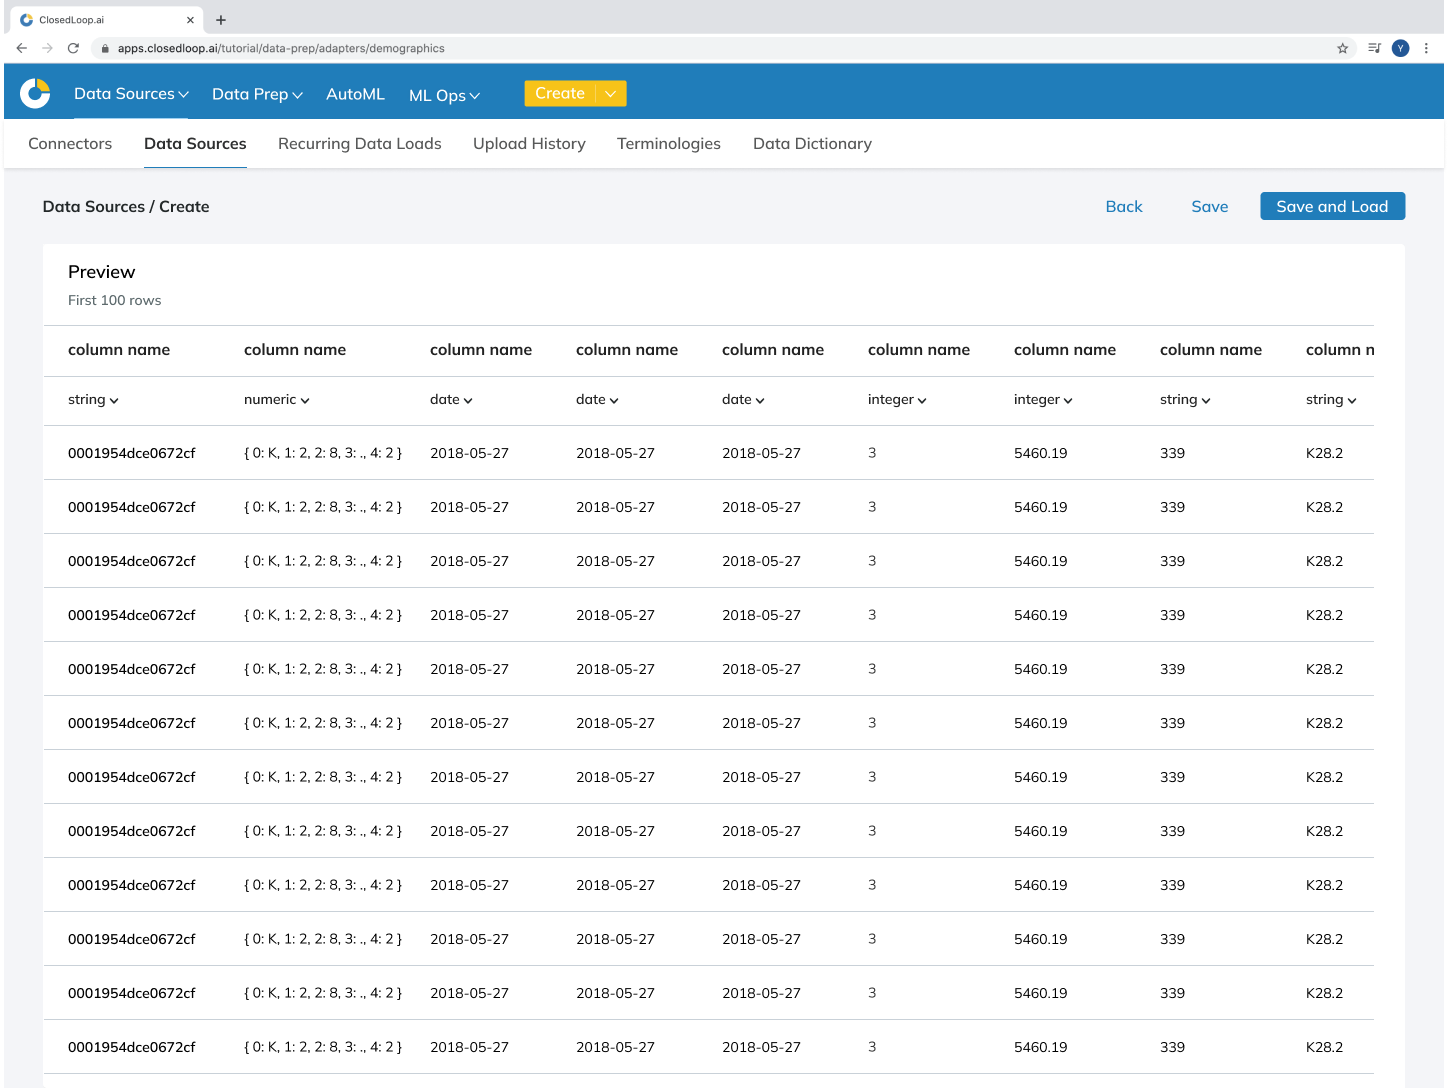
- Understand how users interact with ‘Preview’ and the steps that come after
- Check for understanding of copy for different titles, such as ‘Data Sources’ and ‘Load Path’
- Discover if other options are missing from our UI.
After user testing was complete, the findings and design solutions were synthesized and presented to stakeholders.


Key pieces of feedback
- The ‘Data Sources’ name is unclear as to what is being viewed and created by the user
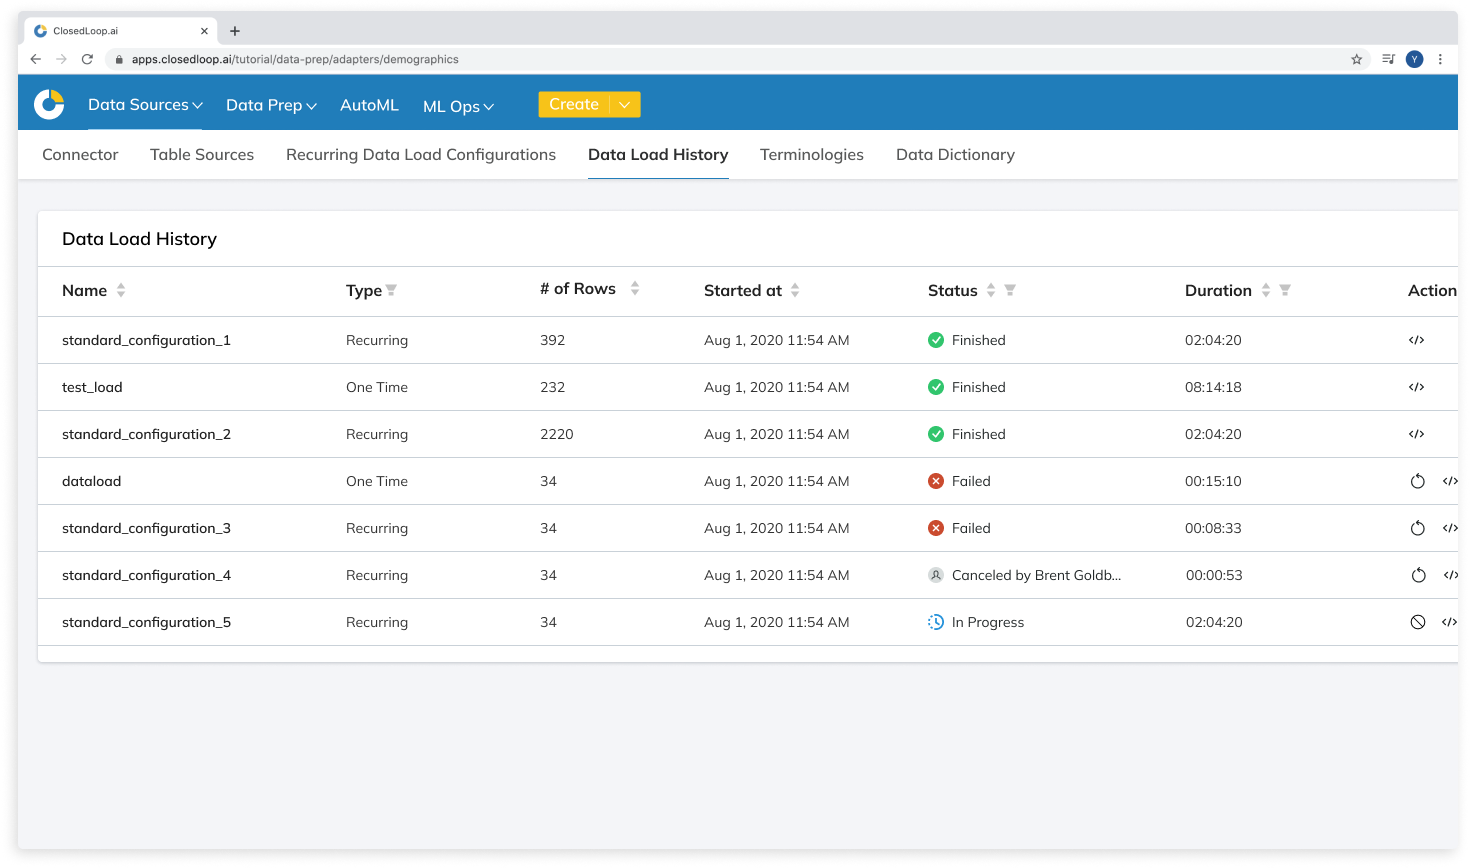
- On the Data Loads History Page, users expressed need for more or different columns
- For Table Sources (FKA Data Sources): Advanced Settings dropdown under the Data Explorer was not the appropriate location for ETL steps.
- For Table Sources, users requested the ability to indicate where the grouping date is in the load path and to group related files together.
How I addressed it
- Stakeholder exercise to narrow down and identify a clearer name for ‘Data Sources’, deciding on 'Table Sources'
- Added and iterated on existing columns to include the necessary functionality.
- Removed the dropdown from the Create screen and added an 'Add or Edit columns' button on the Preview Screen where users could implement ETL steps
- After discussing with backend engineering to clarify technical limitations, designs were added to enable users to highlight the grouping date upon confirming the load path.
V2 HIGH-FIDELITY DESIGNS & INTERNAL/CUSTOMER USER TESTING
High-Fidelity Designs v2
Along with research takeaways and action items, the next version of high-fidelity designs included smaller UI states, corner cases, and additional refinements to enhance the user experience.


Customer & Internal Non-DS User Testing
Testing was done with three customer data science and two internal non-data science users.
Research Goals:
- Understand if users are able to navigate the current flows
- Check for understanding for how users can input and group load paths
- Understand how users interact with ‘Preview’ and adding/editing column functionality
- Check that we have captured everything needed for the Data Loads History page
The designs were easily understood and users successfully completed tasks without issues. Positive feedback was received for this final version:
“This will be really helpful for us to not be as reliant on data scientists to load data.”
“I can easily connect and see how the load is rather than wait a day or two.”
“I know the DS team would be excited to give this to the customer rather than spending 2 hours doing it themselves.”
“It fits really well with what I’ve seen so far with the ClosedLoop platform - nice consistency.”
After user testing was complete, the findings were synthesized and presented to stakeholders.
FINAL SOLUTIONS

HANDOFF
Next steps for design included:
- Prepare a Figma file with finalized designs and any design notes for development.
- Schedule a formal meeting to hand off designs, assets, and documentation to the engineering team.
- Address questions, review timelines and milestones, and ensure design-engineering alignment before development.
- Conduct a post-mortem session for Product Managers to gather feedback and insights for future projects.
- Prepare for product enhancements that were not addressed in the V1 launch.
OUTCOMES
This product succeeded in the overarching goal of creating a faster and stress-free data loading process for internal and external data science users. This reduced the number of errors and the time it took to fix any errors. Given that 100% of the users uploaded their data manually through the data science team, all use of the new Data Loads interface, which increased by 78%, was a success for this early version.
For each load, the Add or Replace Column functionality saved on average:
2 hours per DS user
This new addition to the platform reduced errors by:
53%
While the new addition met early goals, there is much room for growth and development for future versions—including using data-driven insights to understand where errors were occurring, automate solutions, and identify drop-off points for non-data-science users.
TAKEAWAYS
What I learned
- Balancing user needs with evolving technical limitations while maintaining scope were key challenges for this project. I learned to communicate consistently with back-end engineering to maintain alignment with the UI as database capabilities adjusted.
- Following the above point and as the project scope increased, I learned when to advocate for including functionality in an early product release and when to push for prioritizing implementation at a later stage.
What I would do differently
- The weekly meetings that were set up to align all teams on this project weren't conducted from the beginning - I would have set these meetings up before starting any of the design process.
- I would have advocated for deeper consideration of functionality and technical needs earlier and before the design process to avoid design gaps and prevent design challenges from becoming larger than anticipated.
Hey again! You've hit rock bottom... of this page ☺
If you want to learn more about me, what I'm working on, or what I'm up to, feel free to reach out!